Forbes cohort
How to use the data scraped from Forbes to understand how much did the billionaires gain
In beginning of 2021, when trying to know how much did billionaires gain in 10 years, I have seen people comparing the total amount of money owned by all the billionaires in 2010 and 2020, which is wrong (there are more in 2020 than in 2010, so the increase does not represent the average personal gain of the billionaires), and others comparing the mean of the billionaires’ fortune in 2020 and 2010, which is also wrong (because there are a lot of newcomers in the 2020 list, lowering substancially the mean of their fortune).
The proper way to answer the question how much did billionaires gain in 10 years is to construct a cohort, that is find billionaires from 2010 in 2020, calculate their individual fortune change and make some descriptive statistic with this info.
From my previous post, we did get from Forbes the list fo billionaires in 2020 and 2010. I will present here some data management to get a cohort from these data and get some (correct) idea about how much did the billionaires from 2010 gain.
The libraries I will use:
library(stringdist) # to recognize names
library(stringr) # to do some regex stuff
library(ggplot2) # to plot
library(data.table) # to do data handling. If you prefer dplyr, it is ok too
rm(list = ls())
I use `data.table, because I think this is the best R package to handle data in general. I like dplyr too, but data.table is better, faster, and has a shorter and more consistent syntax, which I like. See this post for some equivalence between the two, and this famous question for the comparison between dplyr and data.table ;).
I use str_extract() from {stringr} to extract numerical values
forbes2020[,money := as.numeric(str_extract(money,"[0-9.]+"))]
forbes2020[,age := as.numeric(str_extract(age,"[0-9.]+"))]
forbes2020[,rank := as.numeric(rank)]
and also rename the variable from 2010:
setnames(forbes2010,
         c("Rank","Name","Citizenship","Age", "Net Worth ($bil)"),
         c("rank","name","country","age","money"))
forbes2010[,money := as.numeric(str_extract(money,"[0-9.]+"))]
forbes2010[,age := as.numeric(str_extract(age,"[0-9.]+"))]
forbes2010[,rank := as.numeric(rank)]
To recognize names in the two data base, I cannot rely on simply comparing the strings: I will for sure miss some, because of upper case letters, spaces, etc. Therefore, I create a function to normalize the names, in order to compare them:
normalize_name = function(x){
  tolower(x) %>%
    stringi::stri_trans_general(.,"Latin-ASCII") %>% # remove accents
    gsub("&|and|family","",.)%>%
    gsub("-"," ",.) %>% # replace - by space
    gsub("[ ]{1,}"," ",.) %>% # only one space
  gsub("^[ ]+|[ ]+$","",.)  # remove leading and trailing spaces
}
Here, the function removes all accents, remove some words (&,and,family), and remove additional spaces. I use gsub because of a persistent habit, but str_replace works the same. An example:
normalize_name(c("Martin Machin-truc des écoles ","J Smith Junior and Family"))## [1] "martin machin truc des ecoles" "j smith junior"Now I apply it on my data:
forbes2010[,name := normalize_name(name)]
forbes2020[,name := normalize_name(name)]
To compare the names, I use the library stringdist, to compute the string distance matrix:
dist_mat <- stringdistmatrix(forbes2010$name,forbes2020$name,method = "jw")
dim(dist_mat)
## [1] 950 2325I have a matric with one line per names in the Forbes 2010 list, and one row per names in the 2020 list. The jw method gives a score between 0 and 1, 0 being identical strings and 1 being different ones. I construct the correspondence table by taking the row and column values of below a small threshold:
corr <- as.data.table(which(dist_mat <= 0.05,arr.ind = TRUE))
head(corr)
## row col
## 1: 932 3
## 2: 206 5
## 3: 928 8
## 4: 2 9
## 5: 8 10
## 6: 949 11I obtain thus here the correspondence between the lines from the 2010 list (the rows) and the 2020 list (the col). Let us check: I sample 10 lines of my correspondence table, an bind the name of the two list to compare them:
set.seed(184)
test <- sample(1:dim(corr)[1],10)
cbind(forbes2010[corr[,row],name][test],forbes2020[corr[,col],name][test])
## [,1] [,2]
## [1,] "john menard jr" "john menard jr"
## [2,] "charles bronfman" "charles bronfman"
## [3,] "alec gores" "alec gores"
## [4,] "michael herz" "michael herz"
## [5,] "nassef sawiris" "nassef sawiris"
## [6,] "glenn dubin" "glenn dubin"
## [7,] "patrick lee" "patrick lee"
## [8,] "august von finck" "august von finck"
## [9,] "juan abello" "juan abello"
## [10,] "james dinan" "james dinan"I can sometime have two correspondence: in this case, I take the smallest score of the distance. I thus calculate the number of correspondence for each line (name in 2010 Forbes list)
corr$score <- mapply(function(x,y) dist_mat[x,y],corr[,row],corr[,col])
corr[,Ncoresp := .N,by = row]
And I take the line with the smallest score
cbind(forbes2010[corr[Ncoresp>1,row],name],forbes2020[corr[Ncoresp>1,col],name])## [,1] [,2]
## [1,] "leonard lauder" "leonard lauder"
## [2,] "ronald lauder" "leonard lauder"
## [3,] "jim davis" "jim davis"
## [4,] "michael herz" "michael herz"
## [5,] "leonard lauder" "ronald lauder"
## [6,] "ronald lauder" "ronald lauder"
## [7,] "jim davis" "jim davis"
## [8,] "robert miller" "robert miller"
## [9,] "robert miller" "robert miller"
## [10,] "michael herz" "michaela herz"corr <- corr[,.SD[score == min(corr)],by = row]I then create a unique identifier for these perfect matches:
corr[,id := paste0("perfect",1:.N)]
forbes2010[corr$row,id := corr$id]
forbes2020[corr$col,id := corr$id]
head(corr)
## row col score Ncoresp id
## 1: 932 3 0 1 perfect1
## 2: 206 5 0 1 perfect2
## 3: 928 8 0 1 perfect3
## 4: 2 9 0 1 perfect4
## 5: 949 11 0 1 perfect5
## 6: 929 12 0 1 perfect6From the 950 initial billionaires, I found
forbes2010[!is.na(id),.N]## [1] 586of them in the 2020 list. I am still missing some. I will now try to identify the family names for those without correspondence: I want to catch the misspelled surnames, and the family heritages. The family name is the last word in the name, once removed the Jr, sr, ii and so on:
forbes2010[,lastname := str_extract(gsub(" jr$| sr$| [i]{1,}$","",name),"\\w+$")]
forbes2020[,lastname := str_extract(gsub(" jr$| sr$| [i]{1,}$","",name),"\\w+$")]

forbes2020[,Nlastname := nchar(lastname),by = lastname]
forbes2010[,Nlastname := nchar(lastname),by = lastname]
I re-do a string distance matrix, only for family names having more than 4 letters (for the smaller one, there is too much risk of making a mistake for one letter difference)
familiy_name_lim <- 4
plouf2 <- stringdistmatrix(forbes2010[is.na(id) & Nlastname > familiy_name_lim,lastname],
                           forbes2020[is.na(id)& Nlastname > familiy_name_lim,lastname],method = "jw")
corr2 <- as.data.table(which(plouf2 < 0.02,arr.ind = TRUE))
Let us see what we got:
# verifs
cbind(forbes2010[is.na(id) & Nlastname > familiy_name_lim][corr2[,row],name[1:10]],
      forbes2020[is.na(id) & Nlastname > familiy_name_lim][corr2[,col],name[1:10]])
## [,1] [,2]
## [1,] "jeffrey bezos" "jeff bezos"
## [2,] "william gates iii" "bill gates"
## [3,] "lawrence ellison" "larry ellison"
## [4,] "steven ballmer" "steve ballmer"
## [5,] "s. robson walton" "rob walton"
## [6,] "philip knight" "phil knight"
## [7,] "michele ferrero" "giovanni ferrero"
## [8,] "alain gerard wertheimer" "alain wertheimer"
## [9,] "alain gerard wertheimer" "gerard wertheimer"
## [10,] "james simons" "jim simons"In 2010, Jeff Bezos was called Jeffrey, Bill Gates was called William gates 3 (which is actually his name, see https://en.wikipedia.org/wiki/Bill_Gates ), and Alina and Gerard Wertheimer were consider the same person whereas they are two different entries in 2020, etc. As I want to compare their fortune, I will identif the entry alain gerard wertheimer as being the equivalent of both alain wertheimer + gerard wertheimer. I assign a family identifier in both tables:
corr2[,id := paste0("family",.GRP),by  = row]
forbes2010[forbes2010[is.na(id) & Nlastname > familiy_name_lim][corr2[,row]],
           id := corr2$id,
           on = "name"]
forbes2020[forbes2020[is.na(id) & Nlastname > familiy_name_lim][corr2[,col]],
           id := corr2$id,
           on = "name"]
I found 108 supplementary persons:
forbes2010$id %>% str_extract("[a-z]+") %>% table()## .
## family perfect
## 106 586I check now the missing “big” billionaires:
forbes2010[is.na(id) & money > 10,name]## [1] "david koch" "kwok"
## [3] "anil ambani" "gerald cavendish grosvenor"
## [5] "forrest mars jr" "liliane bettencourt"
## [7] "prince alwaleed bin talal alsaud"I can correct some by hand; Bettencourt changed for Bettencourt Meyers, some Kuehne transformed into Kuhne etc
forbes2020[grepl("wuerth",name),id := "wuerth"]
forbes2010[grepl("david koch",name),id := "koch"]
forbes2020[grepl("julia koch",name),id := "koch"]
forbes2010[name == "forrest mars jr",id := "mars"]
forbes2020[name == "victoria mars" | name =="valerie mars" | name =="marijke mars",id := "mars"]
forbes2010[grepl("wurth",name),id := "wuerth"]
forbes2020[grepl("kuehne",name),id := "kuhne"]
forbes2010[grepl("kuhne",name),id := "kuhne"]
forbes2020[grepl("bettencourt",name),id := "bettencourt"] # changement de nom
forbes2010[grepl("bettencourt",name),id := "bettencourt"] # changement de nom
I want to see the fortune change, so I remove those who died and did not give their money their children (who became billionaires). I consider that billionaires of more than 85 in 2010 that do not appear in 2020 are dead:
forbes2010[(is.na(id) & age > 85),.N]## [1] 30They are 30. I remove these dead persons:
forbes2010 <- forbes2010[!grepl("grosvenor",name)] # dead
forbes2010 <- forbes2010[!grepl("dorothea steinbruch",name)] # dead
forbes2010 <- forbes2010[!grepl("john kluge",name)] # dead
forbes2010 <- forbes2010[!(is.na(id) & age > 85)]
I consider the others as missing in the 2020 list and suppose they lost all their money (that is why they are not in the list)
forbes2010[is.na(id),id := paste0("missing",1:.N)]
forbes2010$id %>% str_extract("[a-z]+") %>% table()
## .
## bettencourt family koch kuhne mars missing
## 1 106 1 1 1 210
## perfect wuerth
## 586 1I then calculate for each list the fortune per id (i.e. including family if I did not find them)
forbes2010_red <- forbes2010[,.(money = sum(money),name = name[1]),by = id]
forbes2010_red[,year := 2010]
forbes2020_red <- forbes2020[!is.na(id),.(money = sum(money)),by = id]
forbes2020_red[,year := 2020]
I then create the cohort:
tot <- merge(forbes2010_red[,.(id,name,money_2010 = money)],
             rbind(forbes2020_red[!is.na(id),.(id,money_2020 = money)],
                   forbes2010_red[grepl("missing",id),.(money_2020 = 0,id)])
             )
head(tot)
## id name money_2010 money_2020
## 1: bettencourt liliane bettencourt 20.0 71.4
## 2: family1 jeffrey bezos 12.3 190.2
## 3: family10 alexei mordashov 9.9 22.8
## 4: family101 fahd hariri 1.4 2.4
## 5: family102 joan tisch 2.7 3.5
## 6: family103 hubert burda 2.5 1.3I save the cohort. You can find the data here (if you are only interested by the data visualization).
fwrite(tot,file = "forbes_cohort.csv")The cohort are all billionaires from 2010, with their fortune in 2020. Those I did not found in 2020 have 0 money. We can then calculate their fortune change: I calculate the difference in billion $, the difference considering 20% inflation in 10 years, and the same but in percentage.
diffdf <- tot[,.(diff = money_2020 - money_2010,
              diff_infl = money_2020 - money_2010*1.2,
              diff_percent = round((money_2020 - money_2010)/ money_2010*100,1),
              diff_percent_infl = round((money_2020 - money_2010*1.2)/ (money_2010*1.2)*100,1)),
              by = id]
diffdf %>% summary()
## id diff diff_infl diff_percent
## Length:894 Min. :-21.600 Min. :-27.000 Min. :-100.00
## Class :character 1st Qu.: -1.200 1st Qu.: -1.560 1st Qu.: -57.02
## Mode :character Median : 0.700 Median : 0.260 Median : 31.95
## Mean : 3.208 Mean : 2.470 Mean : 87.22
## 3rd Qu.: 3.100 3rd Qu.: 2.515 3rd Qu.: 136.82
## Max. :177.900 Max. :175.440 Max. :5041.70
## diff_percent_infl
## Min. :-100.00
## 1st Qu.: -64.17
## Median : 9.95
## Mean : 56.01
## 3rd Qu.: 97.38
## Max. :4184.70We see here that the median increase of the billionaires’ fortune is 700 million $, the mean around 3.2 billion. In percent, the median is 87% increase, and around 55% when corrected from inflation. The biggest increases are:
bigest_gain <- diffdf[order(-diff)][1:10,id]
tot[id %in% bigest_gain]
## id name money_2010 money_2020
## 1: family1 jeffrey bezos 12.3 190.2
## 2: family2 william gates iii 53.0 120.5
## 3: family3 lawrence ellison 28.0 88.9
## 4: family4 steven ballmer 14.5 78.9
## 5: family5 s. robson walton 19.8 84.4
## 6: perfect1 bernard arnault 27.5 148.8
## 7: perfect11 jack ma 1.2 61.7
## 8: perfect2 mark zuckerberg 4.0 99.6
## 9: perfect4 larry page 17.5 80.2
## 10: perfect8 ma huateng 3.6 68.0It is weird not to see Elon Musk in a top 10 about fortune, but he actually was not a billionaire in 2010… The biggest losses are:
bigest_loss <- diffdf[order(diff)][1:10,id]
tot[id %in% bigest_loss]
## id name money_2010 money_2020
## 1: family105 ingvar kamprad 23.0 3.3
## 2: family71 eike batista 27.0 5.4
## 3: family95 paul allen 13.5 1.5
## 4: missing1 anil ambani 13.7 0.0
## 5: missing2 mohammed al amoudi 10.0 0.0
## 6: missing210 prince alwaleed bin talal alsaud 19.4 0.0
## 7: perfect146 christy walton 22.5 7.8
## 8: perfect307 michael otto 18.7 3.7
## 9: perfect458 shashi ravi ruia 13.0 2.2
## 10: perfect84 lakshmi mittal 28.7 13.8It seems right: Anil Ambani bankrupted, Mohamed al Amoudi does not seem to be in Forbes 2020 list (?), prince Alwaleed Bin Talal Alsaud has been removed too, etc.
Here is a simple data viz of the fortune increase in percentof all the billionaires of 2010 from our (not perfect) cohort:
diff_plot <- rbind(diffdf[,.(year = 2020,id,diff_percent,diff)],
                   data.table(diff_percent = 0,diff = 0,year = 2010,id = diffdf$id))
ymin = -100
ymax = 600
p <- diff_plot %>%
  ggplot(aes(as.factor(year),diff_percent,group = id))+
  geom_hline(yintercept = 0,linetype = "dotted",size = .2)+
  geom_line(size = .4,alpha = 0.05)+
  geom_vline(xintercept = 2,size = .3)+
  coord_cartesian(ylim = c(ymin,ymax),xlim = c(1,2))+
  theme_light()+
  scale_y_continuous(breaks = seq(-ymin,ymax,100))+
  theme(panel.grid.major.y = element_blank(),
        panel.grid.major.x = element_blank(),
        panel.grid.minor.y = element_blank(),
        axis.title.y = element_text(margin = margin(r = 3,unit = "mm")),
        plot.title = element_text(hjust = 0.5),plot.subtitle = element_text(hjust = 0.5))+
  labs(x = "",y = "% change of fortune",
       title = "How much did the 907 billionaires\n of 2010 gain in 10 years",
       subtitle = "Median increase of 30%, mean increase of 86%",caption = "@denis_mongin\ndata: Forbes")

arrowdf <- diffdf[order(-diff_percent)][1:6][,.(xend = 1+600/diff_percent,
                                        xarrow = 0.7,id,yend = 600,
                                        yarrow = 600 - (.I-1)*100)]
arrowdf[forbes2010[,.(name,id)],name := i.name,on = "id"]

 p +
  geom_curve(data = arrowdf,
             aes(x = xarrow,xend = xend,y = yarrow,yend = yend),
             curvature = -.1,arrow =arrow(length = unit(2, "mm"),type = "closed"),
             color = "grey60" ,size = .2,alpha = .6)+
  geom_text(data = arrowdf,aes(xarrow-0.1,yarrow - 20,label = name),size = 3,alpha = 0.5)+
  annotate(geom = "curve",
           x = 2.2, y = 100,
           xend = 2, yend = -100,
           curvature = -.2,
           color="grey50",
           size = .2,alpha = .6,
           arrow = arrow(length = unit(2, "mm"),type = "closed"))+
  annotate(geom = "text",
           x = 2.25, y = 220,
           label = "
           We suppose that
           all billionaires from 2010
           not in the 2020 list
           have lost
           all their fortune
           ",
           hjust = "center",
           color="grey50",alpha = .6,size = 3)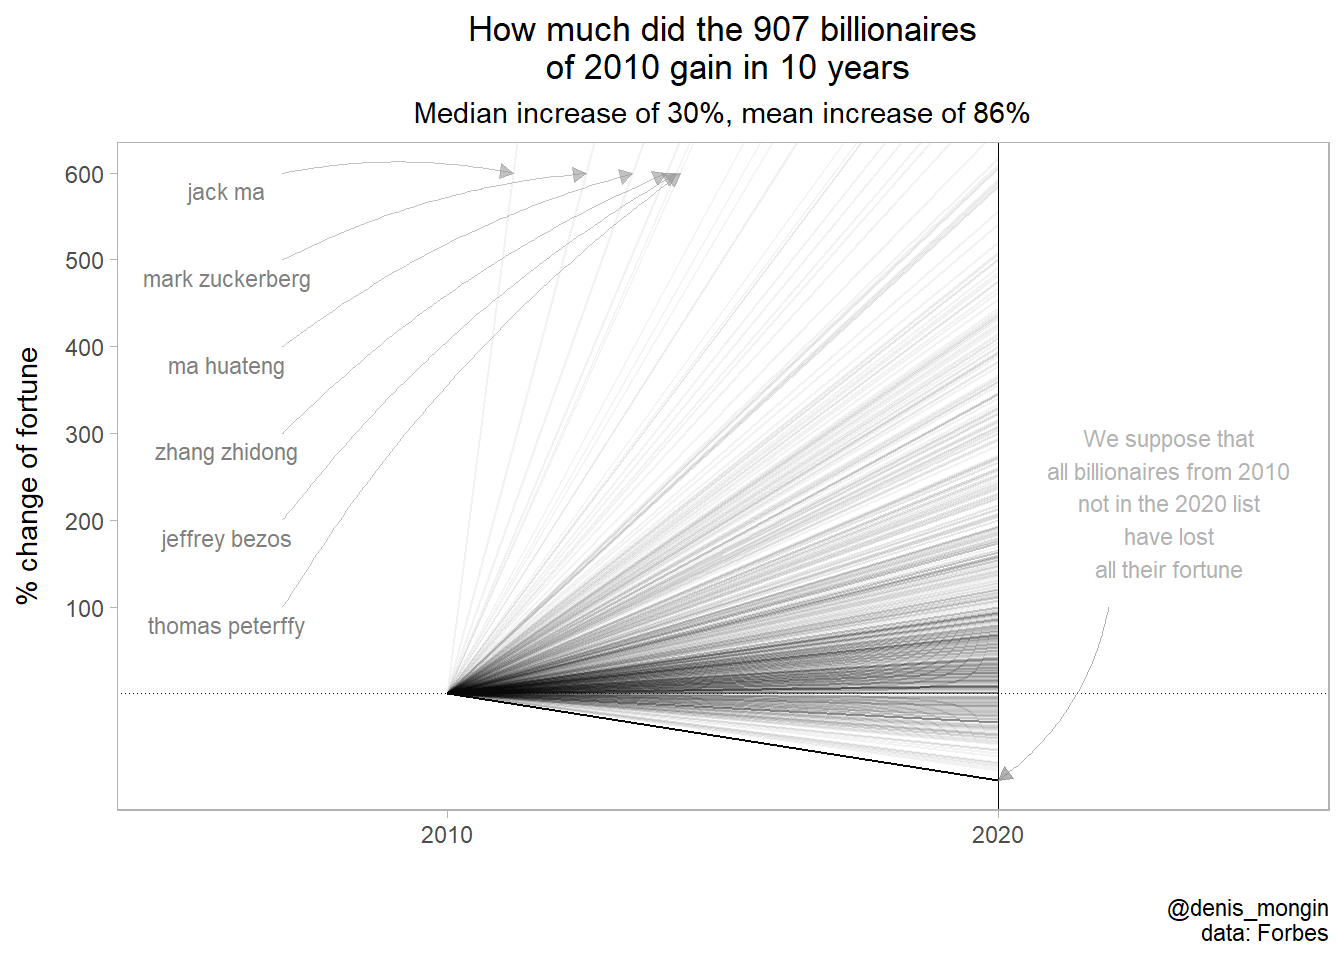
Et voilà. This a rather conservative approach, in the sense that I surely missed some of the billionaires, and considered that they lost all their fortune. So if there is a bias, I underestimate the billionaire’ gain.